
The plain-language companion to "The Vision Basin" (Zenodo, 2026) — published, per house rules, with its own failed experiments in plain view. Full works below.
Our last story delivered a plot twist: that famous four-bit AI speed limit was never bolted inside the machine. It was hiding in the words — in how much genuine surprise ordinary language actually contains. The machine was just a mirror, faithfully reflecting whatever we fed it.
Which sets up an irresistible dare. If the limit really lives in the food and not the eater, then feeding a machine a different kind of food — pictures instead of prose, sound instead of sentences — ought to land it at a different line entirely. Same idea, different diet, different basin. So we went and fed the machines eyes and ears.
Three Senses, Three Waterlines
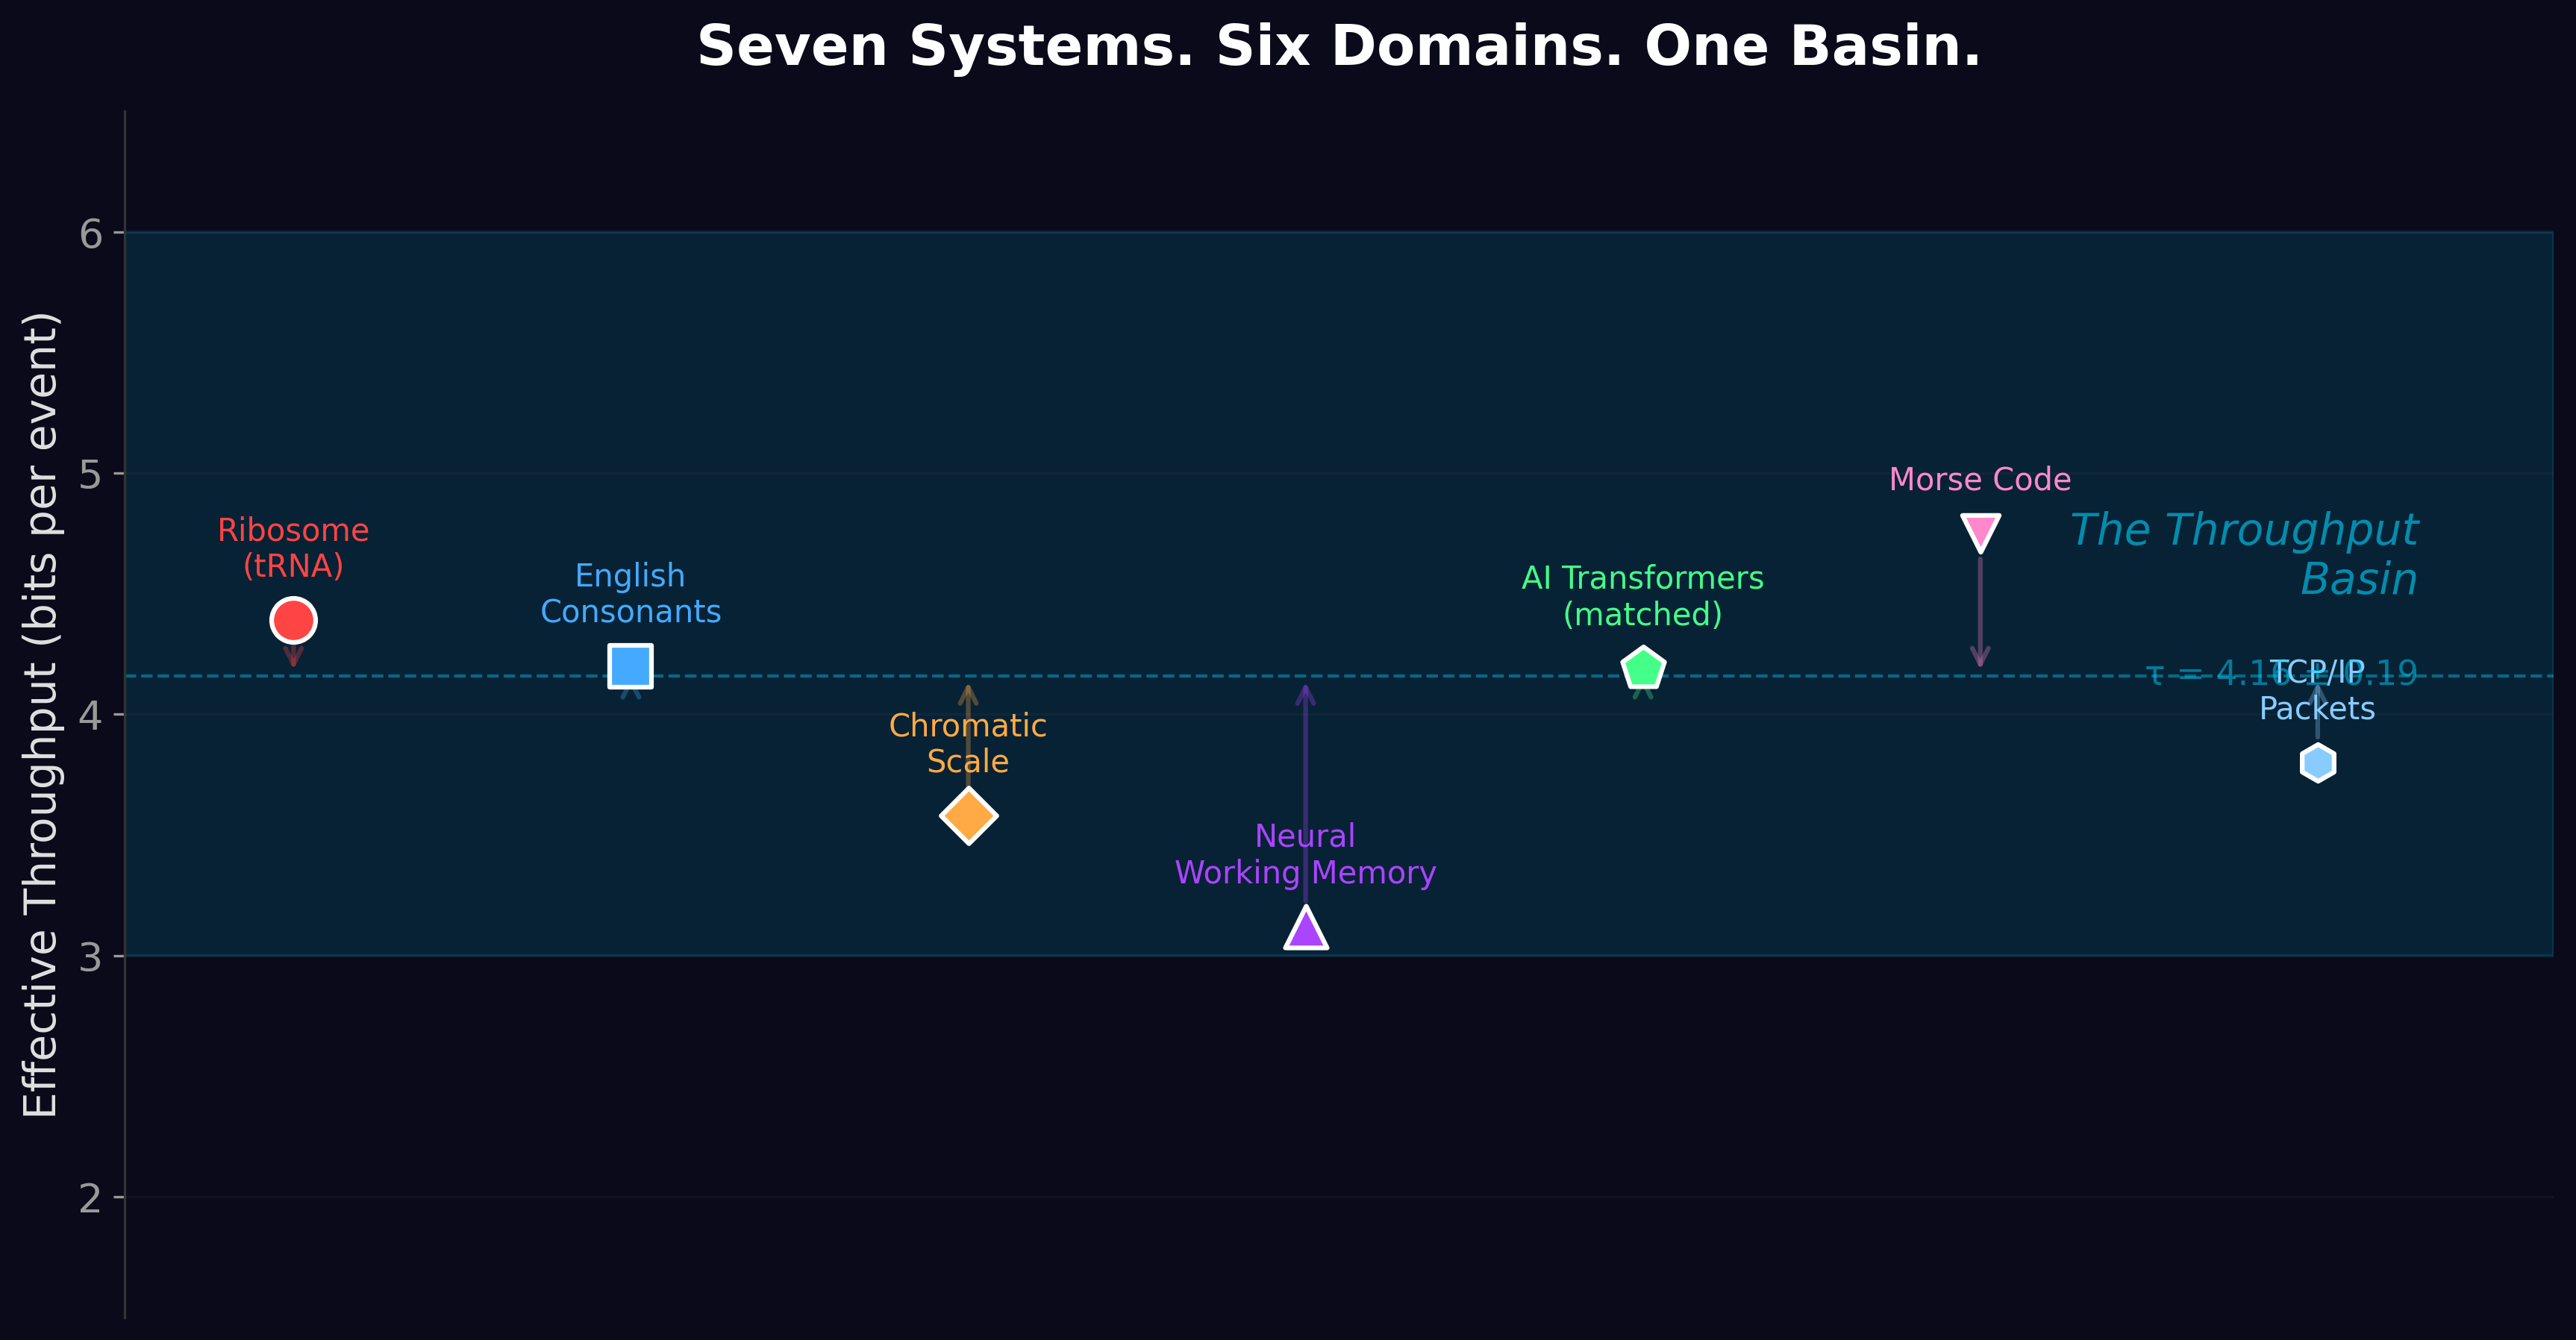
Picture each kind of data as a different drink poured into the same glass. We measured how full the glass gets — how much real, useful prediction a machine squeezes out per bit of raw material — for words, for images, and for sound. And they filled to three plainly different waterlines. Words settle around one line. Pictures fill a good bit higher. Speech higher still, and music higher than speech. Every sense has its own basin, set by its own diet. The limit follows the food, exactly as the mirror story predicted.
And the controls behaved like perfect little soldiers: feed a machine pure static — visual snow, or the hiss of silence — and it extracts precisely nothing, because there's nothing in there to extract. Which is the whole point. It's not that the machine is dumb on noise; it's that noise is empty. The glass only fills as high as the drink allows.
The Blender, Now With Pictures
Remember the blender trick from our language story — scramble the words and watch meaning evaporate? We ran it on images. Trained a machine to predict pictures, then handed it those same pictures progressively shredded — quadrants swapped, blocks jumbled, pixels confettied. Sure enough, the intact photos were easier to predict than the scrambled ones. There's real, exploitable structure in a picture, just like in a sentence.
But here's a lovely wrinkle: the visual "structure bonus" is about ten times smaller than language's. And that makes gorgeous sense once you say it out loud. Language is a skyscraper of nested structure — sounds inside words inside grammar inside meaning inside conversation, floor upon floor. A picture is a bungalow by comparison: nearby pixels, objects, scenes, and not much more. More floors of structure, more bonus. Language is simply the deeper, richer, more layered thing — and the numbers know it.
The Honest Part About What We're Measuring
Here we have to slow down and be scrupulous, because it'd be easy to fudge and we won't. When we say a machine "extracts more" from images than from words, we're being a little loose — the yardsticks aren't identical. For language we measure how badly the machine is surprised (lower is better); for images we measure how much it gains by looking (higher is better). Those point in opposite directions, so you can't just line the raw numbers up and crown a winner. The honest, careful claim — the one that does hold across all three — is simpler and truer: in every sense, pure noise yields zero exploitable bonus, and real structure yields a real one. That's the universal law. The exact heights are apples and oranges, and we say so.
The Experiment That Blew Up (and Why We're Telling You)
Now the part the institute exists for. We wanted the cleanest possible test: build fake images at carefully dialed levels of complexity and watch a machine, trained from absolute scratch, react. Our first attempt failed. Flat-out broke — numbers that made no sense. We could've quietly buried it and rerun until it looked pretty. Instead we diagnosed the flaw (a subtle contamination, cousin to a bug we'd caught in the language work), fixed it, and published the corpse right next to the cure.
The clean redo taught us something we'd have gotten wrong otherwise, and it's worth being precise about. On unpredictable images — various flavors of noise — the machine's error doesn't climb neatly with complexity the way we'd first assumed. It flattens out, because past a certain point noise is just noise; you can't predict any of it, so more "complexity" doesn't make it harder in the way you'd expect. The real, unmistakable signal is elsewhere: hand the machine images with genuine structure — gradients, blob-like objects — and it reconstructs them about six times better than noise of the same raw messiness. The machine compresses what's compressible and shrugs at what isn't. That's the visual echo of the whole arc: what you carry equals what's there, minus what you can cleverly predict away.
Careful With That Four-Bit "Coincidence"
Somebody always notices that natural images clock in around four bits per pixel while natural language sits near four bits per chunk, and gets excited about a cosmic constant. We had to talk ourselves down from that ledge, and then talk you down too. The image number isn't fixed — it slides around depending on the resolution and which compressor you use. Shrink the picture and the number changes. It's a coincidence wearing a convincing costume, not a law of nature. We'd rather kill our own darling than let you cite a mirage.
What It All Means
There is no single magic speed-limit number ruling over all of reality. There's a rule, and the rule spits out a different number for every kind of data: about one line for words, higher for pictures, higher still for sound. Each sense has its own basin, and every basin obeys the same simple recipe — how much is really in there, minus how much a good student can already guess.
Which leaves one nagging skeptic's question still standing. We keep talking about these "bits" and these "basins" as if they're real, physical things. But are they? Or are they just bookkeeping — numbers on a spreadsheet with no teeth in the actual world? To answer that, we had to stop measuring software entirely and go all the way down to the metal: the literal switches on a silicon chip. That's Paper 9, and it's where the abstract finally gets its hands dirty.
The Vision Basin is Paper 8 of the Windstorm series.
Zenodo (concept DOI, always-latest): 10.5281/zenodo.19672827 ·
Current version v2.2 (April 2026): 10.5281/zenodo.19672827 ·
Code & data: github.com/Windstorm-Institute/vision-basin
Download the full paper (PDF) ·
Grand Slam Supplementary Materials (PDF)
Comments & questions
Comments are powered by GitHub Discussions. Sign in with your GitHub account below, or browse all discussions on GitHub. No GitHub account? It takes 30 seconds to make one — or email Grant directly if you'd rather skip it.